VIA-MD
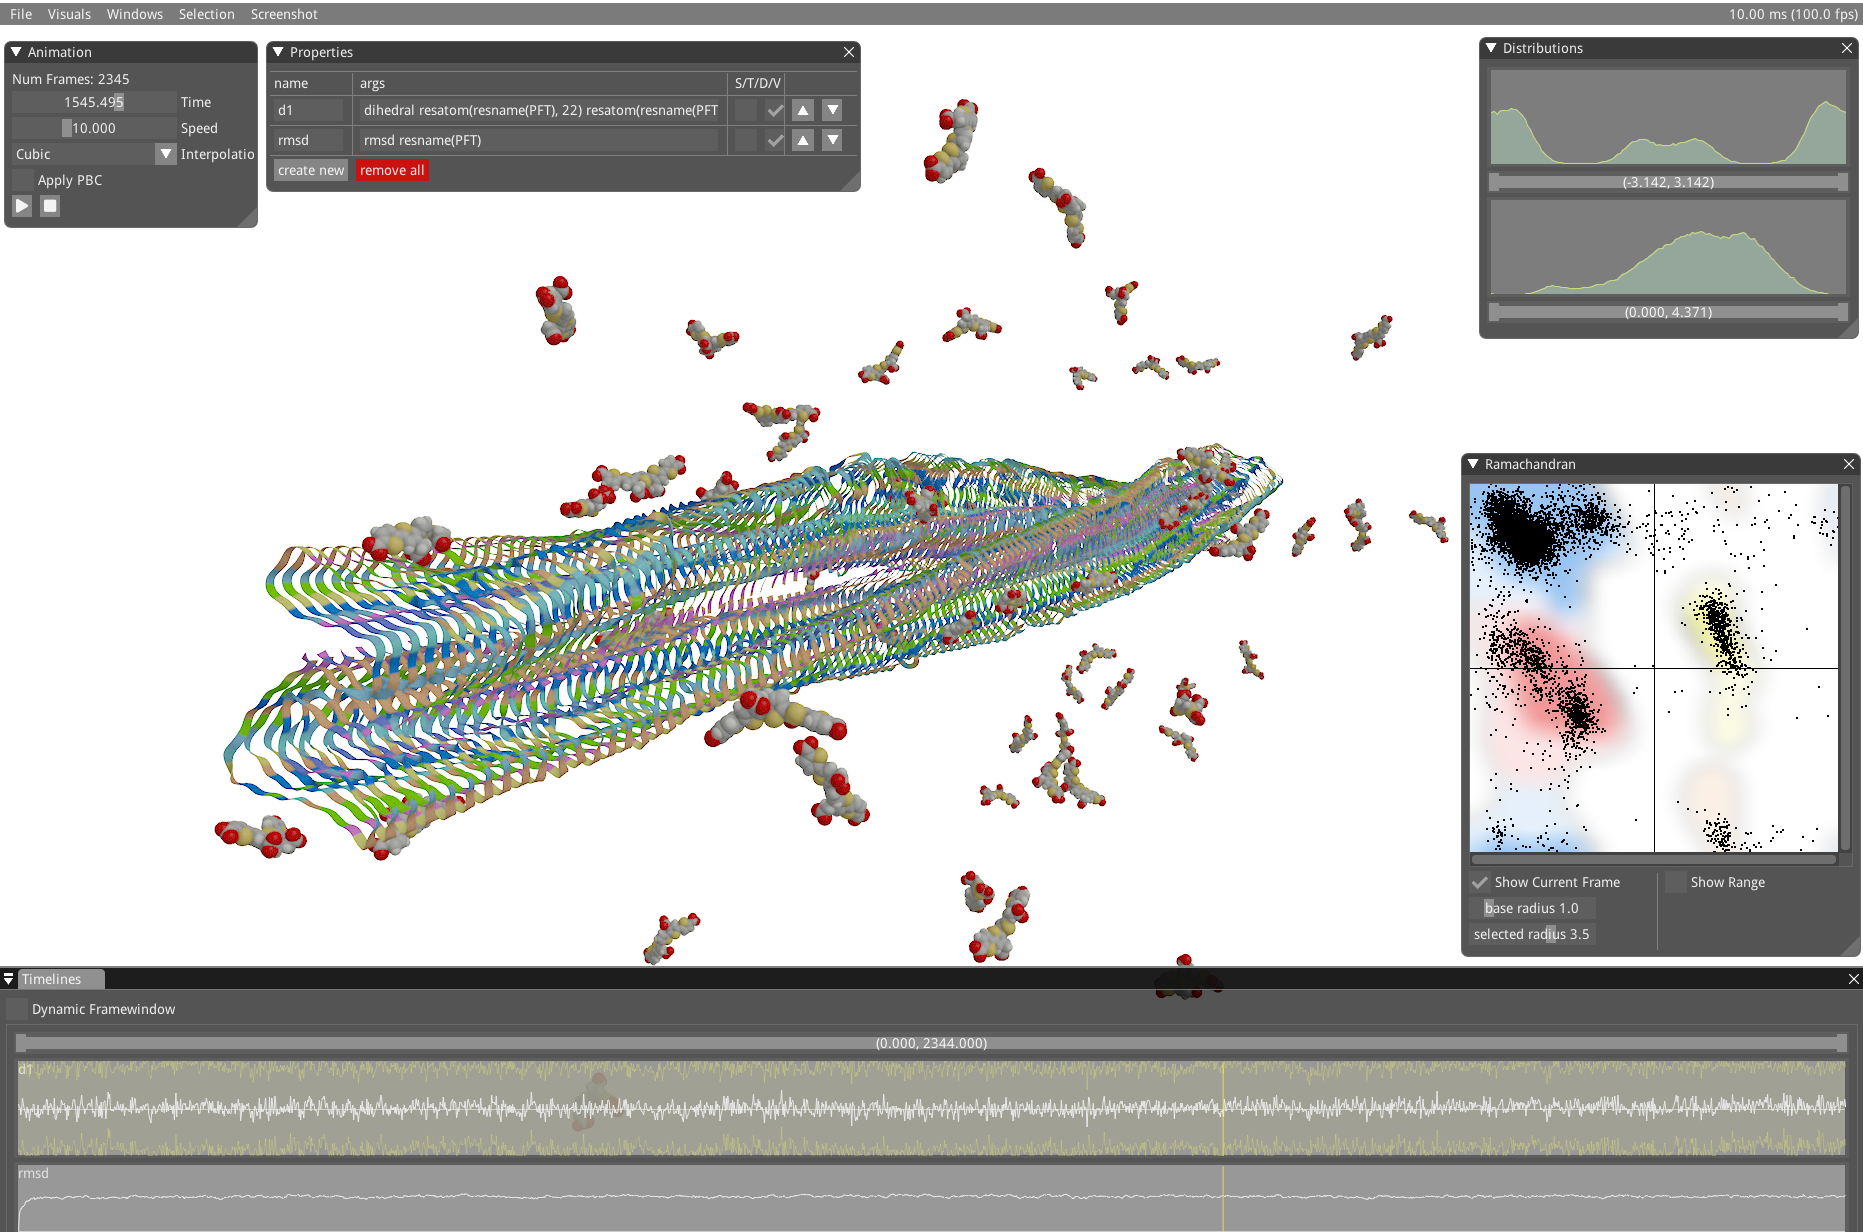
VIA-MD is an explorative visualization tool for Molecular Dynamic data. The goal of the project is to incorporate the analysis into the visualization. The benefit of having the analysis together with the visualization is that we maintain the visual context of the molecules and reduce iteration time for users.
The source code is available on our Github repository.
Goals
- Maintain interactivity
Features
- Context-aware scripting language for selection and property computation.
- Maintains visual context
- Provides direct feedback based on your loaded dataset
- Basic visual representations of molecules
- van Der Waals (Spheres)
- Ball + Stick
- Cartoon
- Ribbons
- Property visualization
- Timeline: Temporal Line graphs
- Distributions
- Spatial Distribution Functions
- Interactive filtering
- See where certain property values occur within the timeline
- Supported molecular file formats
- PDB
- GRO
- XTC
People involved
Funding
- SERC